
The Machine Does Not Care and Executes Better Than You
A mechanical move closed a correct SPX trade at -68%. This is what CTAs, short covering, and gamma do to a position, and the exit rule that was missing.
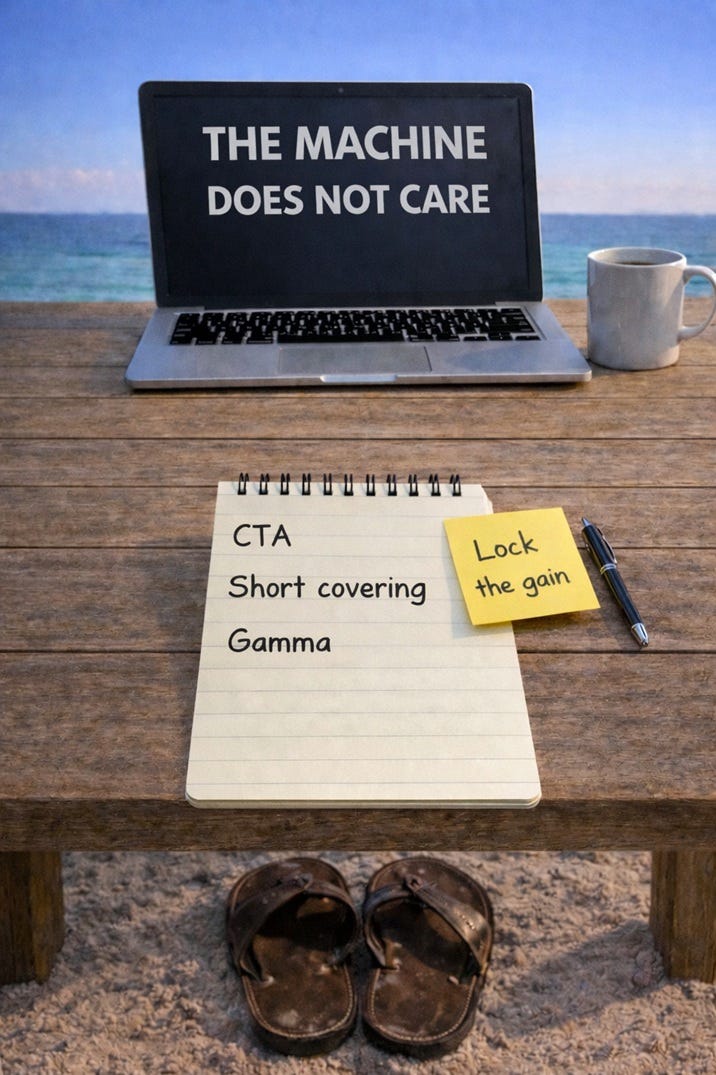
I have owned two cars in my life that broke down on me. Both of them picked the same moment to do it: right after a full tank of gas. One of them died on the road on the way back from a job interview. I got the job.
The car breaking down did not make the destination wrong.
Quick facts:
· Underlying + structure: S&P 500 Bear Put Spread 6600/5900, April 2026 expiration
· Window: two entries, 02-Mar-2026 and 09-Mar-2026. Exited 08-Apr-2026, afternoon session.
· Max risk: 9% of spread width on first entry, 16% on second entry
· Result: -68% at kill switch exit

The Chain of Events
This position was documented live before it closed. The full pre-trade reasoning is in My 5-Check System Before I Buy. When all indicators pointed in the same direction, the position was built across two entries in early March.
Both entries respected the confirmation rules the system requires, waiting for multiple bar closes before the order was sent. That discipline is covered in Entry Forbidden for Impatient Traders.
The thesis was clear and the catalysts were dated.
Here is how the final two weeks played out:
March 30: SPX low at 6,316.91, lowest since September 2, 2025. Position peaks near +200%.
March 31 to April 2 (short week, Good Friday April 3 closed): SPX grinds higher on light volume. The position erodes each session. This pattern has happened before: the market breathes during holiday-shortened weeks, the thesis does not change. Stay Cold Under Pressure. The long weekend ahead carries the next catalyst.
April 5 (Easter Sunday): Trump posts on Truth Social: “Tuesday will be Power Plant Day, and Bridge Day, all wrapped up in one, in Iran.” Deadline set: 8pm ET Tuesday April 7.
April 6 (Easter Monday, market closed): Trump at the White House: “Every bridge in Iran will be decimated by 12 o’clock tomorrow night, every power plant burning.”
April 7 (Tuesday, deadline day): Market closes nearly flat. Ceasefire announced after the close.
April 8 (Wednesday): Gap up at the open. SPX +2.51%, closes at 6,782. Kill switch triggered during the session. Position closed at -68.3%.
This journal is a public record of a process being built in real time. Being honest about what failed is the only way to make it last. Before drawing any conclusion from this loss, one mistake needs to be acknowledged: ignoring mechanical rallies in 2026, when the world runs on AI and machine learning, is inexcusable. Not because the world has changed. In fact, the architecture behind that machine has not changed since 1987. A machine read a signal, triggered a chain of events, and a sound thesis with a good position is now gone.
Subscribe for free if you want the next posts and the rules as they evolve.
How the machine works : may the forces be with you
When a market gaps sharply upward after a sustained period of selling, three mechanical forces activate. They don’t have feelings like greed, FOMO or panic, but they do have a process with rules, and they are great at executing them. None of them ask whether the move is justified or read news. Those three forces started activating when the market bounced off its six-month low. The unexpected ceasefire announcement after a long weekend did not just trigger them. It detonated them.
The first force is CTA positioning. Commodity Trading Advisors manage systematic momentum strategies across dozens of major indices, monitoring signals on three time horizons simultaneously: short-term around 10 to 20 days, medium-term around 50 to 100 days, and long-term around 200 days. The logic is identical on all three: if price is above the moving average, the model sends buy orders. If price is below, it sends sell orders. Goldman Sachs monitors approximately 63 of these signals across 21 indices. When a gap up pushes price back above multiple moving averages in a single session, like the one documented in Hormuz, Suez, and a Setup That Appeared 8 Times in 97 Years, those 63 signals can flip from negative to bullish simultaneously. The models then send buy orders for days or weeks.
The second force is short covering. When a market has been declining, short positions accumulate. A sudden upside move forces those positions to close, which means buying. That buying pushes the market higher. That higher price forces more short covering. That covering pushes the market higher again. The loop has no natural end until the short positions are exhausted.
The third force is gamma exposure from short-dated options. Dealers who sell options must continuously adjust their hedges as prices move. A sharp upward move forces those dealers to buy the underlying to remain hedged. That buying adds fuel to a rally that was already mechanical in origin.
Those three forces do not care if the war ends, if Hormuz is closed, if supply chains are disrupted, or if a tanker that needs 35 days from Hormuz to Europe cannot make it faster when the strait reopens. The machine does not evaluate the thesis. It executes the signal. One important detail: the mechanic works both ways, up and down.
The Machine Always Comes Back
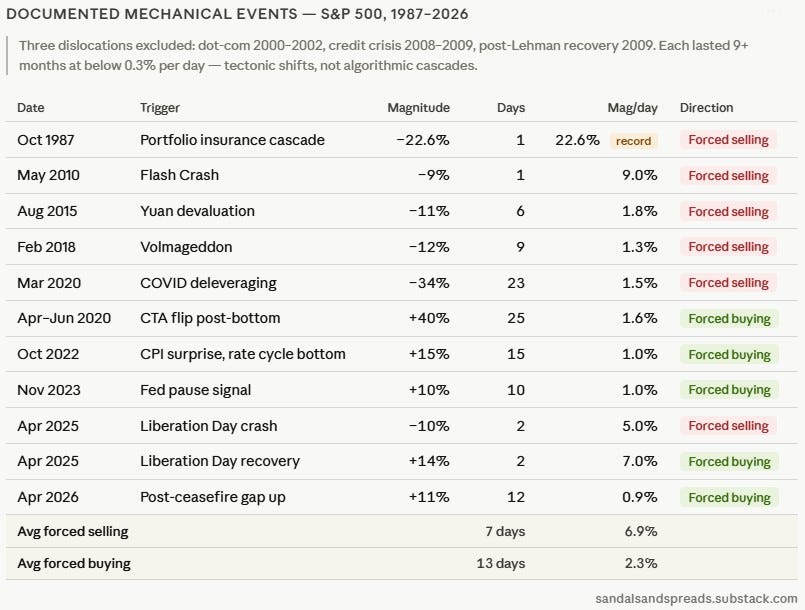
The Brady Commission documented the identical self-reinforcing loop after Black Monday in October 1987, when portfolio insurance algorithms sold futures automatically as the market fell, accelerating a single-day decline of 22.6%, still the largest one-day percentage drop in the history of the DJIA. The trigger was algorithmic, not fundamental. The technology has evolved and the volumes have multiplied, but the architecture is the same: a rule-based machine amplifying a move that had already started.
Below is a selection of documented mechanical events on the S&P 500 since 1987, crashes and rallies both.
Three major market dislocations were excluded from this table: the dot-com unwind of 2000-2002, the 2008-2009 credit crisis, and the 2009 post-Lehman recovery. Each lasted more than nine months with a magnitude below 0.3% per day. They were tectonic shifts driven by fundamental recalibration over time, not algorithmic cascades with a defined trigger and a fast resolution. That distinction is precisely what the magnitude/day column below is designed to capture.
Two observations stand out :
1. the cadence is accelerating. From 1987 to 2010, a major mechanical event occurred roughly every five to twelve years. From 2015 onward, the interval has compressed to one to three years. From 2022, it has dropped to months. The growth of algorithmic trading, the interconnection of global markets, the ease of access to markets for retail, the « meme » and social media era, have turned rare events into recurring ones.
2. on average, crashes are faster and more intense than recoveries. The data shows selling events averaging 7 days at 6.9% per day, against buying events averaging 13 days at 2.3% per day. The April 2025 recovery at 7% per day is the exception that proves the rule. The structural reason is documented since Kahneman and Tversky: the pain of a loss is psychologically twice as intense as the pleasure of an equivalent gain. Panic is faster than optimism. The machine amplifies what humans already do.
But 1987 did not have what today’s market has. In 2025, 0DTE options represented 59% of total SPX options volume, averaging 2.3 million contracts per day according to Cboe. A 0DTE option expires the same day it is bought. It is the options market equivalent of instant gratification: maximum leverage, no overnight risk, and the result is known before the market closes. The concept did not exist before 2022 on a daily basis. It is the product of an era where everything is immediate, from information to execution to loss.
When dealers sell them and the market moves sharply, they are forced to trade the underlying to stay hedged, amplifying every move in both directions. The machine that existed in 1987 now has a new accelerator, and it fires every single trading day.
Retail traders sit at the end of that chain and now account for nearly half of total daily options volume. They are always the last to enter and the first to absorb the impact. That was true in 1987, it is true today and it will be true in 2062.
AI will not slow this down, it will speed it up.
How to Lock a Gain Before It Grinds My Gears
The kill switch closed the position on the gap up. That part of the system functioned correctly. What was missing was a different rule, one designed to protect gains that had already exceeded the original target. On earnings trades, the exit date is known before the order is placed. I have repeatedly said that on earnings trades, I voluntarily exit with 20% left on the table rather than give it back to the market. But this was not an earnings trade. It was a macro position held over several weeks, a format with different rules and, as it turns out, a gap in them. Two things matter before drawing conclusions from the decision to hold:
1. Both entries still had a lot of margin
Entry 1 — March 2, debit 63:
Max return: +1011%
Captured at peak: +200% = 20% of maximum
Still ahead: 80% of maximum
Entry 2 — March 9, debit 115:
Max return: +509%
Captured at peak: +200% = 39% of maximum
Still ahead: 61% of maximum
With several weeks remaining, two dated catalysts, and a thesis that had not changed, and still more than 60% of the maximum ahead on each entry, it did not feel like the moment to close the trade. That was the logic of my reasoning and why I chose not to close the trade.
2. Sizing: this trade resulted in the second largest drawdown in the system since the process was formalized. The first was documented in The Mistake That Built My System. The difference between the two is measurable. The sizing rules in the current system kept the account intact. The system stays in the game for the next one.
This trade exposed a gap in the system: I have a kill switch that remains active at the absolute level for protection against a full loss. But I did not have a rule that fires when a position starts giving back significant gains. The kill switch protects the capital on the downside. Nothing was protecting the gains on the upside.
The rule that closes this gap is called Peak Lock. The principle is a ratchet: as the position clears defined gain thresholds, a floor is set automatically. If the position retraces to that floor, it closes immediately, one-shot, no exception. The floor never moves down. It only moves up as new thresholds are cleared.
The table is simple:
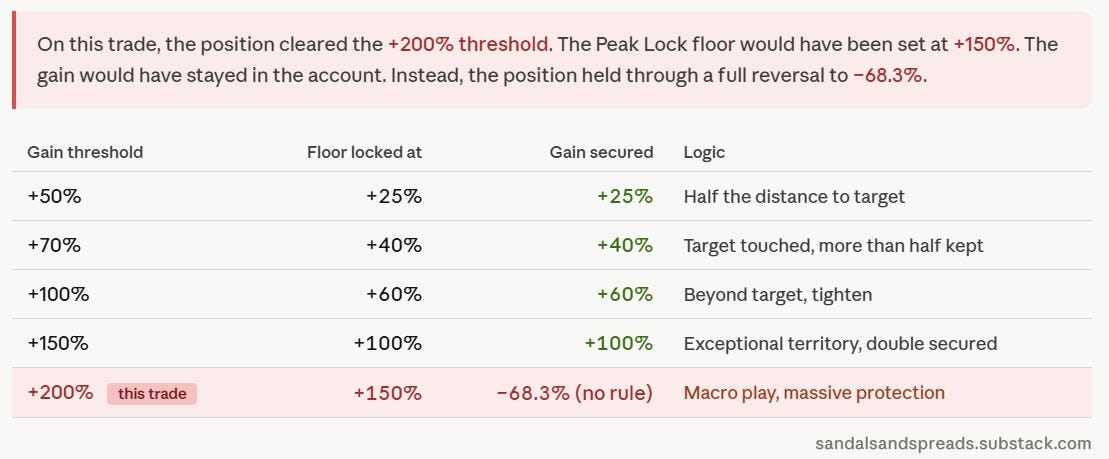
Rule: Once a gain threshold is cleared, a floor locks in automatically, and if the position retraces to that floor, it closes, regardless of the thesis.
Checklist:
Before entry: is the maximum window defined, with a hard date limit regardless of thesis?
Before entry: are the five Peak Lock thresholds calculated and written in the log?
In trade: if a gain threshold is cleared, is the new floor noted and active?
In trade: if a binary event over a weekend can gap against the position, is the scenario written before the market closes Friday?
After exit: does the drawdown from this trade change behavior on the next setup?
Next step
A correct thesis and a clean process are not enough on their own. A Good Thesis Can Still Lose Money is a good reminder.
If you are new here, Start Here.
Subscribe if you want the next posts and the rules as they evolve.